Fast Food Accessibility, Population Exposure, and Obesity Patterns in California
A visualization-centered overview of a spatial research project examining how fast food accessibility and nearby population exposure relate to obesity rates, with emphasis on 2SFCA modeling, spatial clustering, and spatial regression results.
Abstract
This project presents a spatial analysis of the relationship between fast food restaurant accessibility and obesity rates across California census groups. Population exposure and accessibility were examined using distance-threshold analysis, Gaussian-weighted spatial decay, and a Two-Step Floating Catchment Area (2SFCA) framework. Census geometry, population estimates, obesity prevalence, and fast food sales data were integrated to estimate how fast food supply and demand interact across space. Additional analyses include Local Getis-Ord hotspot detection and maximum likelihood spatial regression models. Although visualization results suggest some localized inverse-looking patterns between accessibility and obesity, the overall relationship appears weak and spatially inconsistent, highlighting the complexity of obesity as a socially and behaviorally mediated outcome.
Introduction
This webpage is intended as a general overview and presentation of visualization results from the research project. Full numerical results, technical specifications, model diagnostics, and formal interpretation are intentionally omitted here and will be provided in the complete research paper.
Obesity remains one of the most persistent public health concerns in the United States, and the built food environment is often discussed as one potential contributor. Fast food restaurants are especially relevant because they are widespread, convenient, and frequently associated with calorie-dense diets. At the same time, the relationship between fast food availability and obesity is not straightforward, since eating behavior is shaped by income, mobility, commuting, delivery services, neighborhood structure, and broader lifestyle patterns.
The goal of this project is to examine whether spatial access to fast food is meaningfully related to obesity rates, and whether that relationship changes depending on the spatial scale used to define access. Rather than relying on a single arbitrary neighborhood radius, the project compares multiple distance thresholds and weighting schemes before constructing a fast food accessibility score for each census group.
2SFCA Background
This project is conceptually grounded in the Two-Step Floating Catchment Area (2SFCA) method, a widely used spatial accessibility framework originally developed to study access to services such as healthcare. In general, 2SFCA works by first measuring a supply-to-demand ratio around each service location, and then aggregating those ratios for each population location. This makes it more informative than simple distance measures because it accounts for both the presence of services and the competition for those services from nearby population.
In this study, 2SFCA is adapted to the fast food environment by using fast food restaurant sales volume as a proxy for supply and census population as a measure of demand. This allows each census group to be assigned an accessibility score that reflects not only proximity to fast food but also the relative concentration of population competing for that supply.
Data Used
CDC PLACES
Used for obesity prevalence estimates at the census group level.
TIGER/Line
Used for census geography and spatial coordinates for block group polygons and centroids.
U.S. 2020 Census
Used for population estimates to represent local demand around fast food locations.
Methodology
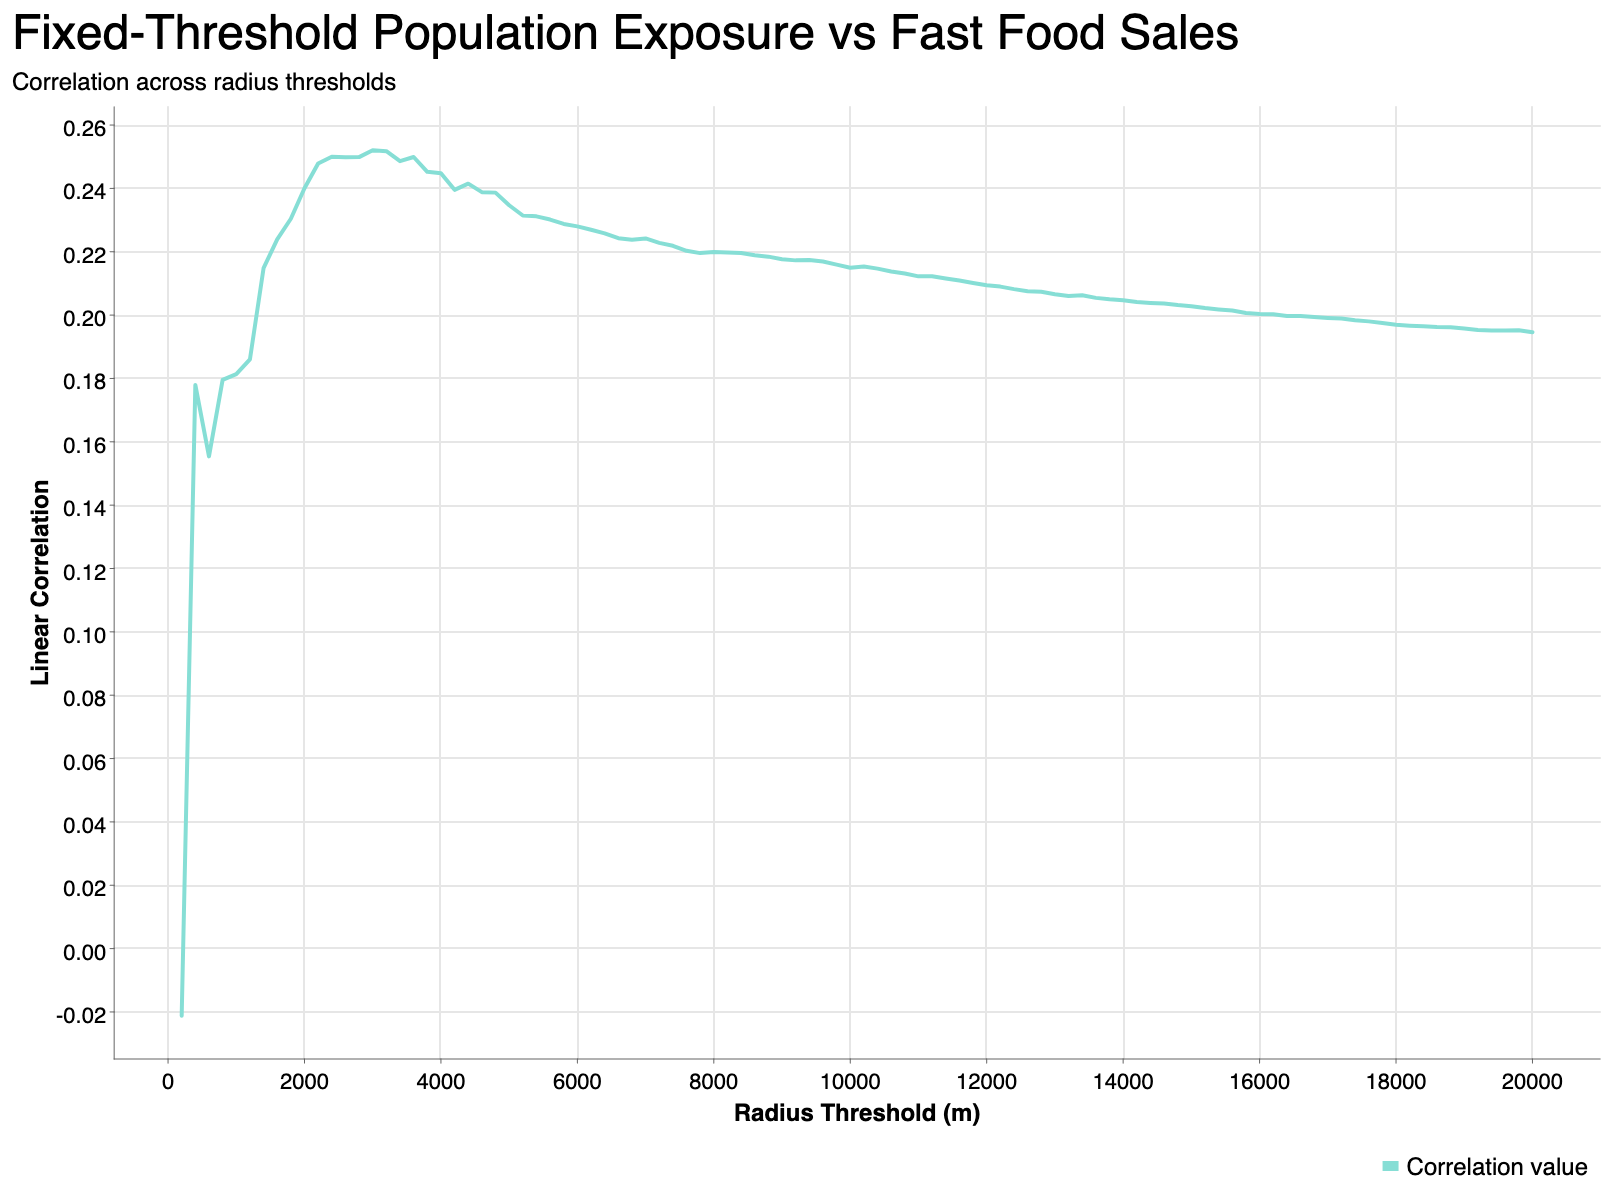
The first stage of analysis focused on spatial scale selection. Census groups were represented using weighted centroids, and fast food restaurant data was aggregated into a fixed 2 km grid. Distances were then calculated between census group centroids and fast food grid centroids in order to measure nearby population exposure under different radius assumptions.
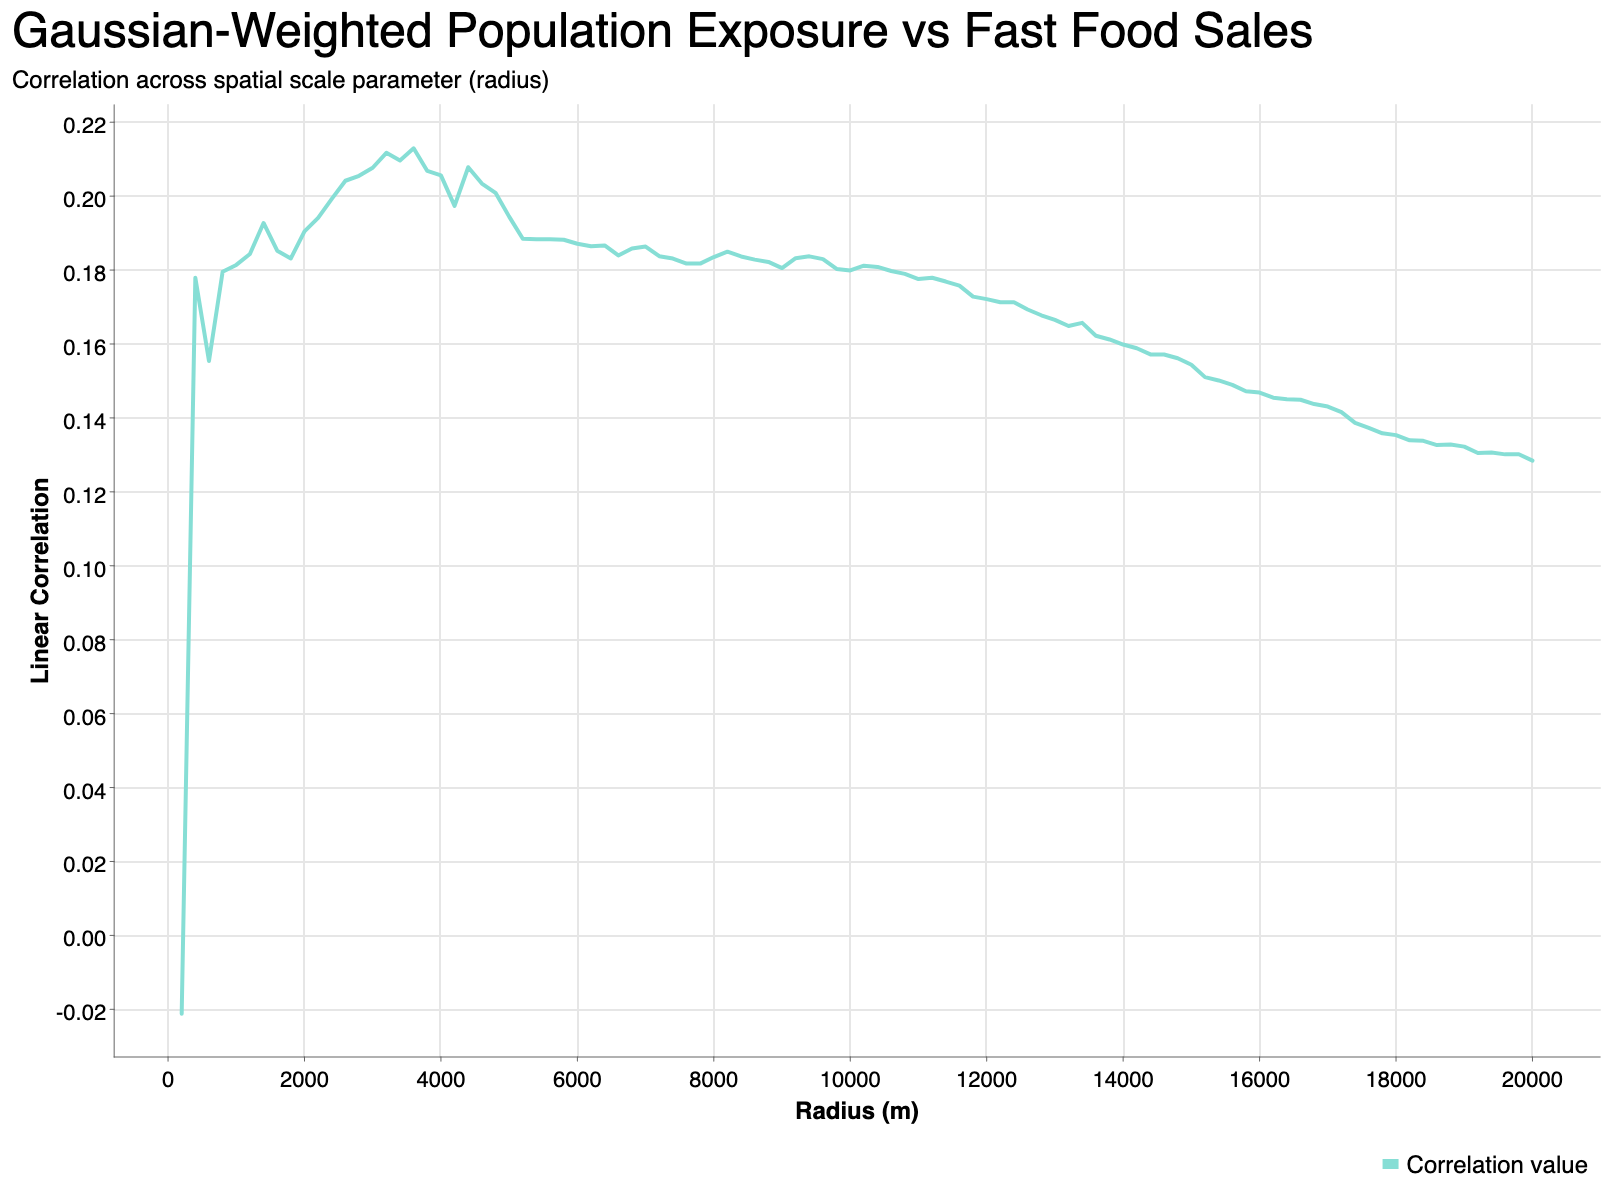
Two primary approaches were used in this threshold analysis: a fixed-distance method and a Gaussian-weighted distance-decay method. In the fixed model, only fast food grid cells within a chosen radius were considered. In the Gaussian model, nearby locations were weighted continuously so that closer fast food clusters contributed more strongly than farther ones. For each spatial scale, the resulting population exposure metric was compared against fast food restaurant sales volume using linear correlation.
Across the tested radii, the strongest observed correlation occurred at approximately 3500 meters, suggesting that this spatial scale best captured the local population–sales relationship in the threshold analysis stage. This value is therefore used as the catchment radius in the subsequent 2SFCA accessibility calculation, defining the spatial extent within which population demand and fast food supply are considered when computing accessibility scores.
2SFCA Accessibility Calculation
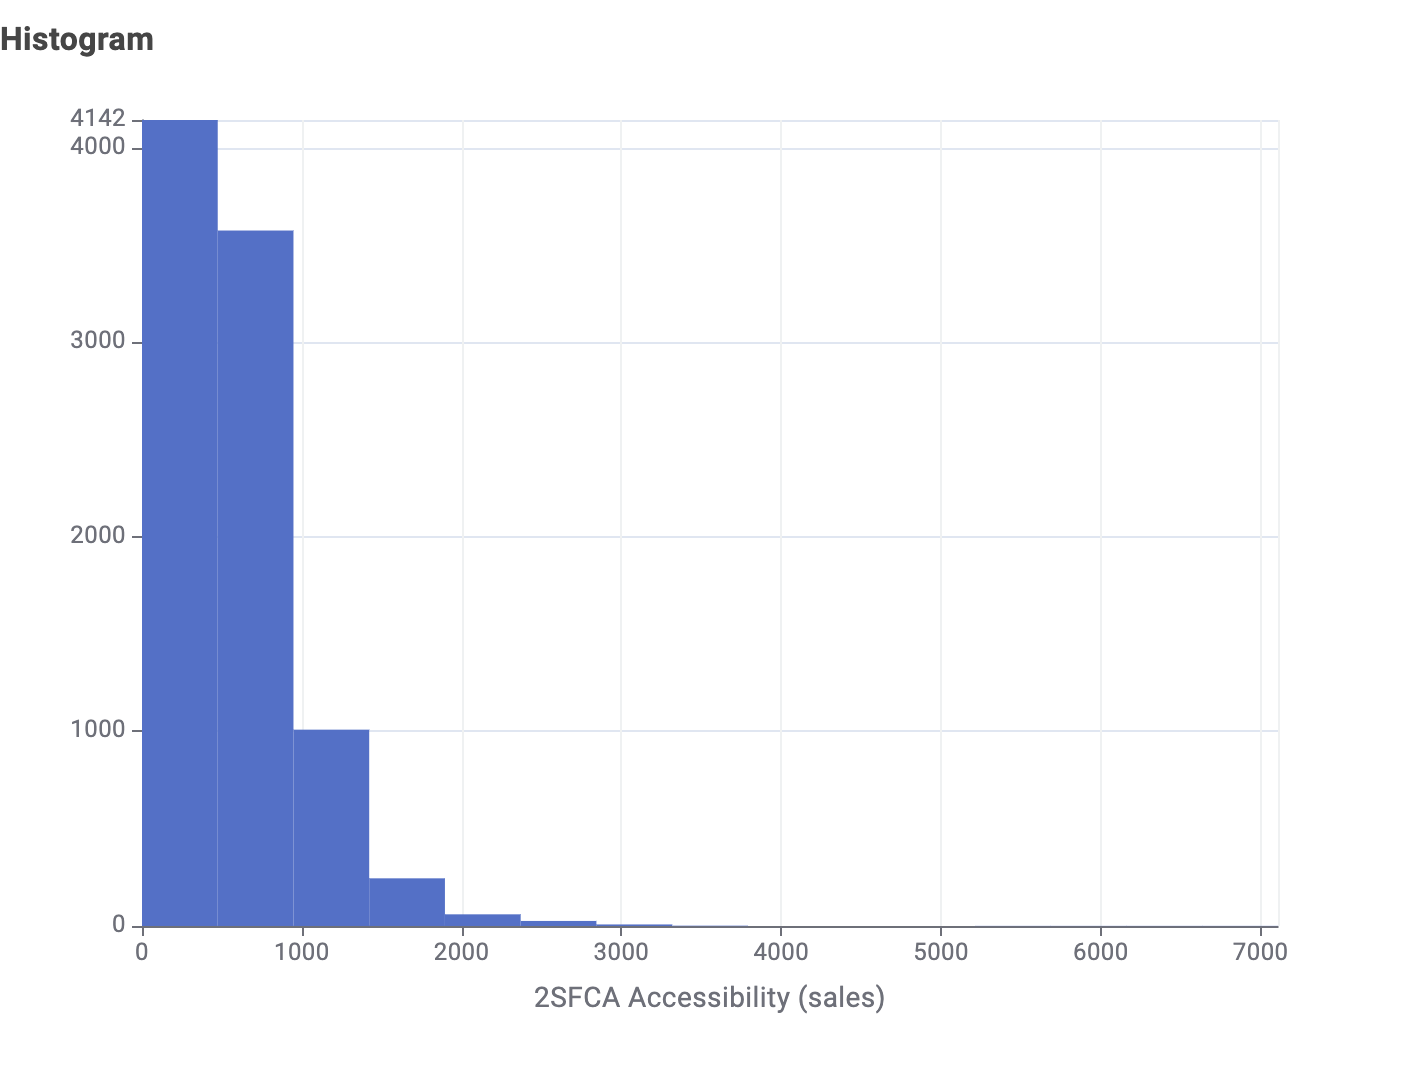
For this project, the 2SFCA framework is adapted from healthcare access to the fast food environment. Instead of healthcare providers, the service locations are fast food restaurant grid cells, and instead of provider capacity, fast food sales volume is used as a proxy for supply. Population from census groups represents local demand. First, each fast food grid cell is assigned a supply-to-demand ratio based on its sales volume relative to the surrounding population within the selected catchment distance. Then, for each census group, the nearby fast food supply ratios are summed to produce a 2SFCA accessibility score.
This means that a higher score indicates that a census group has relatively greater fast food supply available compared to nearby population demand, while a lower score indicates more limited supply relative to the number of surrounding residents. In general, the 2SFCA score can be interpreted as a measure of how accessible fast food is after accounting for spatial competition. In the context of this project, it provides a more informative measure than simple distance or restaurant counts because it incorporates both the concentration of fast food activity and the population that may rely on it.
Exposure analysis
Used to study how nearby population relates to fast food sales across different spatial scales.
2SFCA analysis
Used to estimate accessibility by balancing fast food supply against local population demand.
Results and Analysis
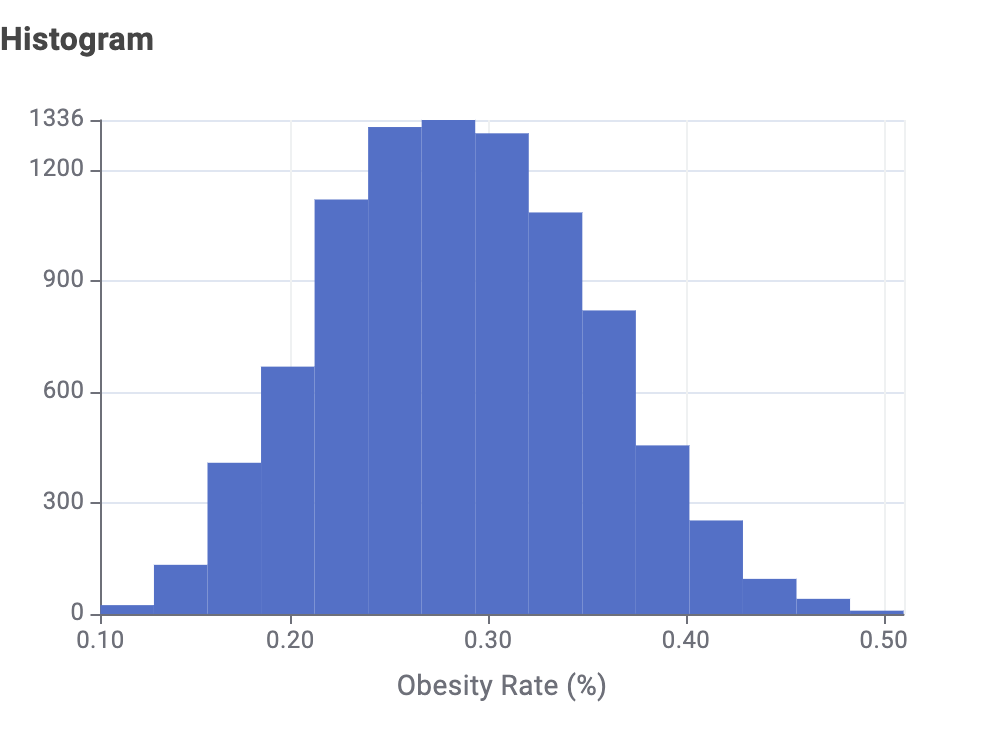
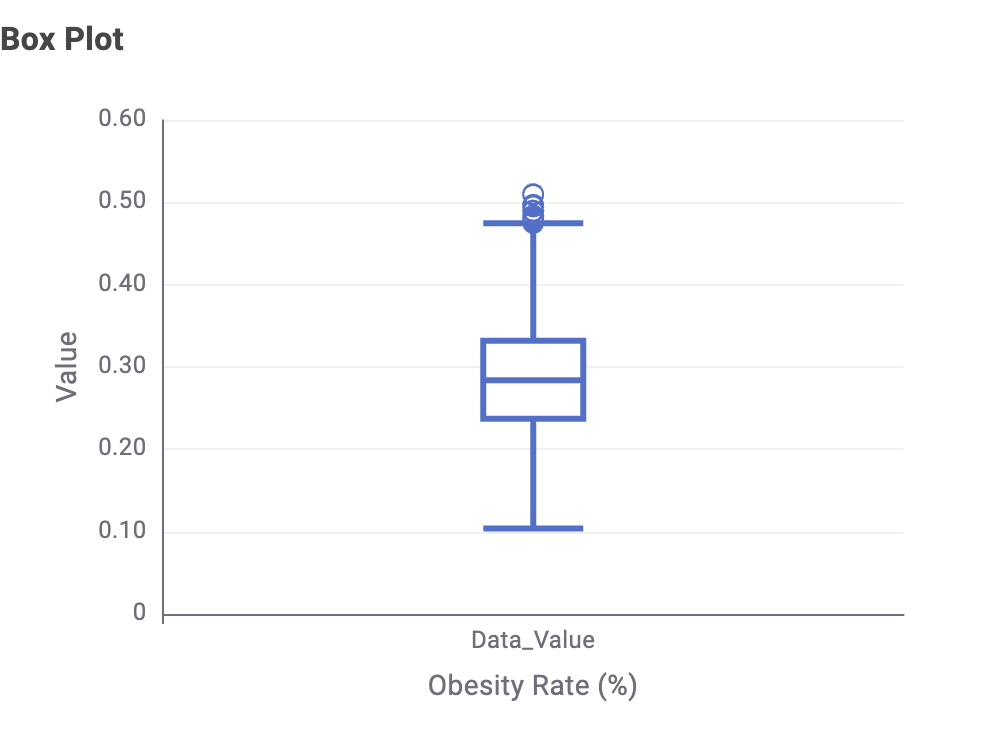
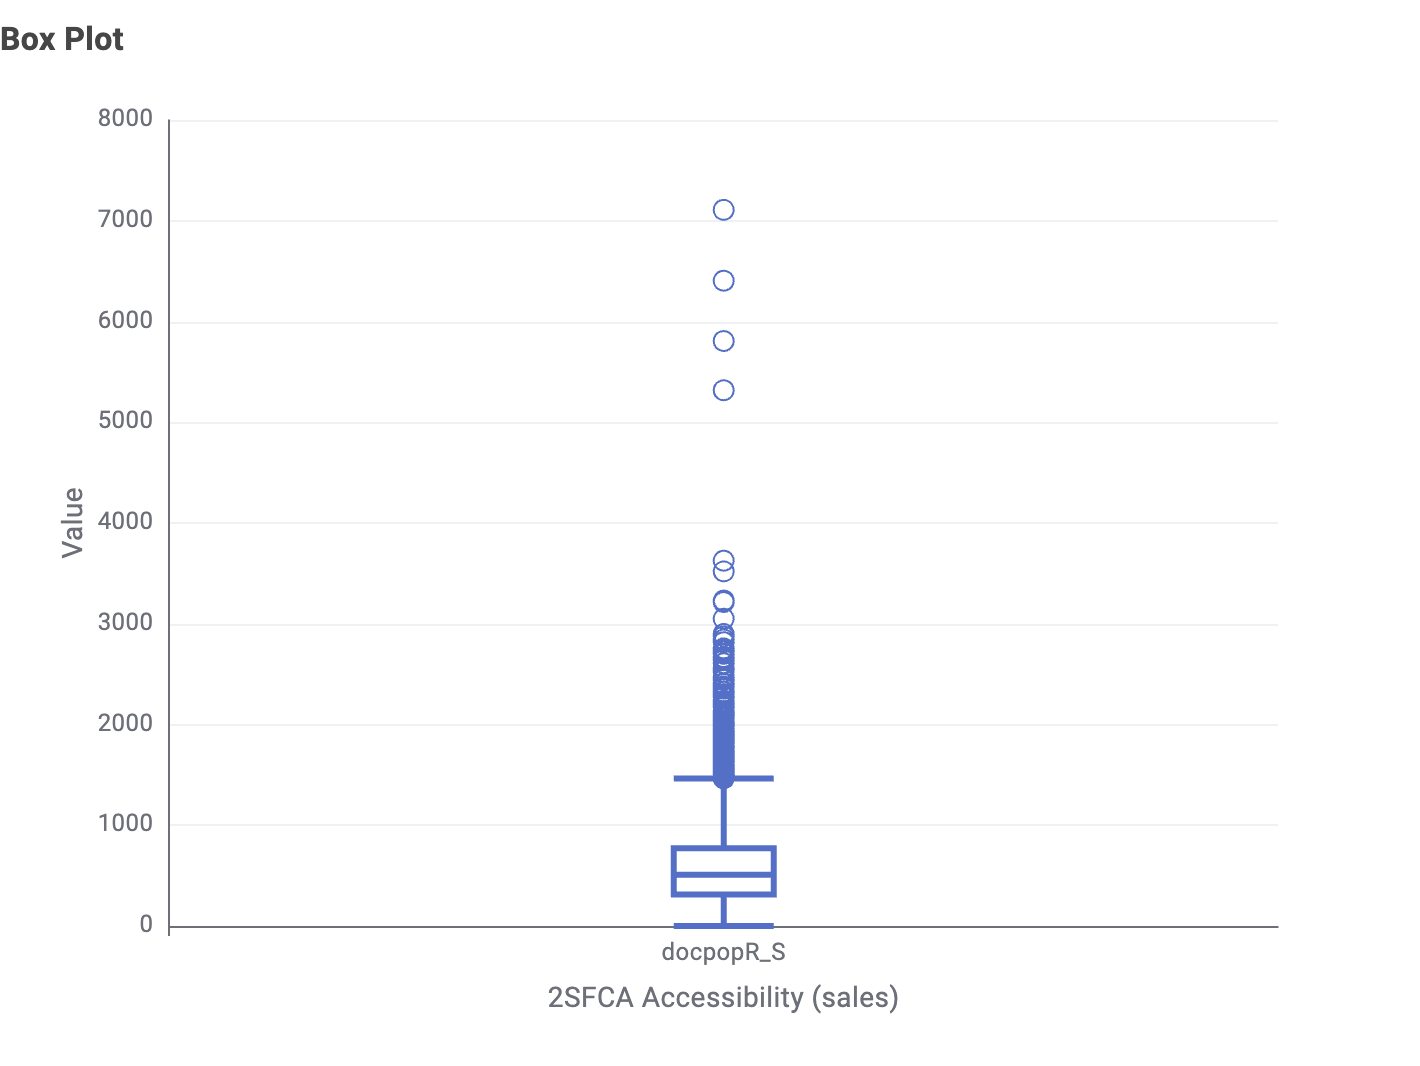
Distribution of Obesity and Accessibility
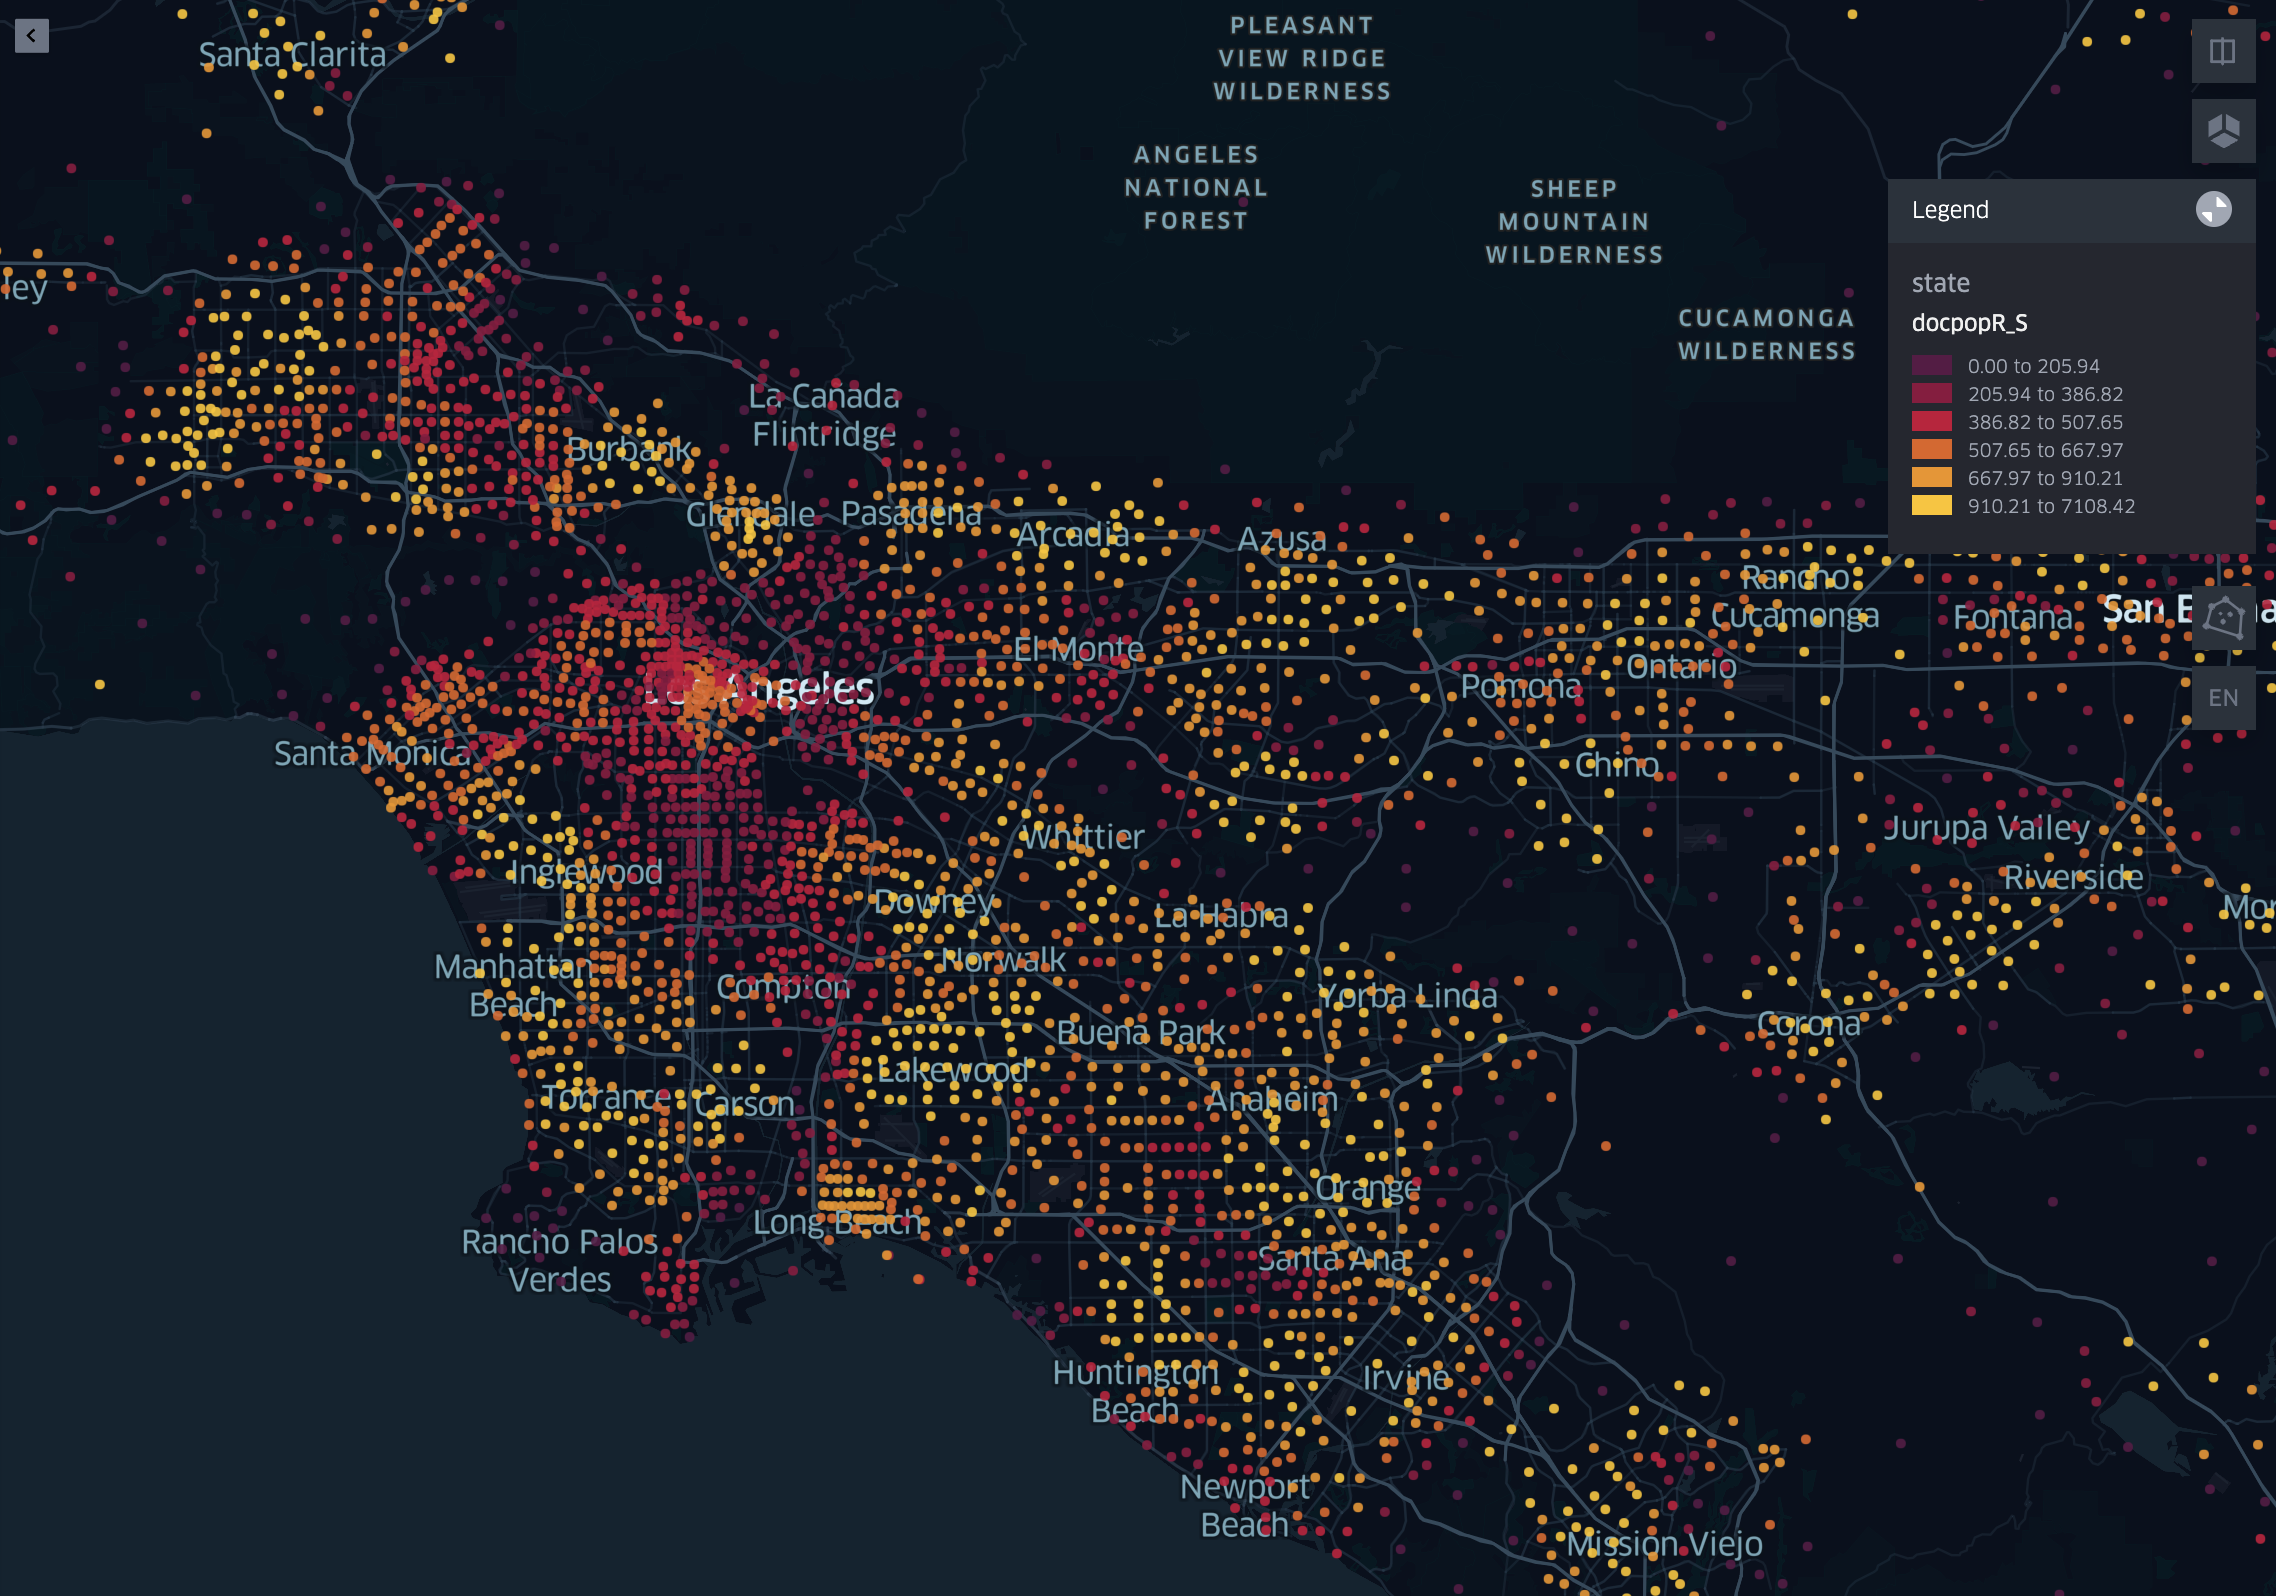
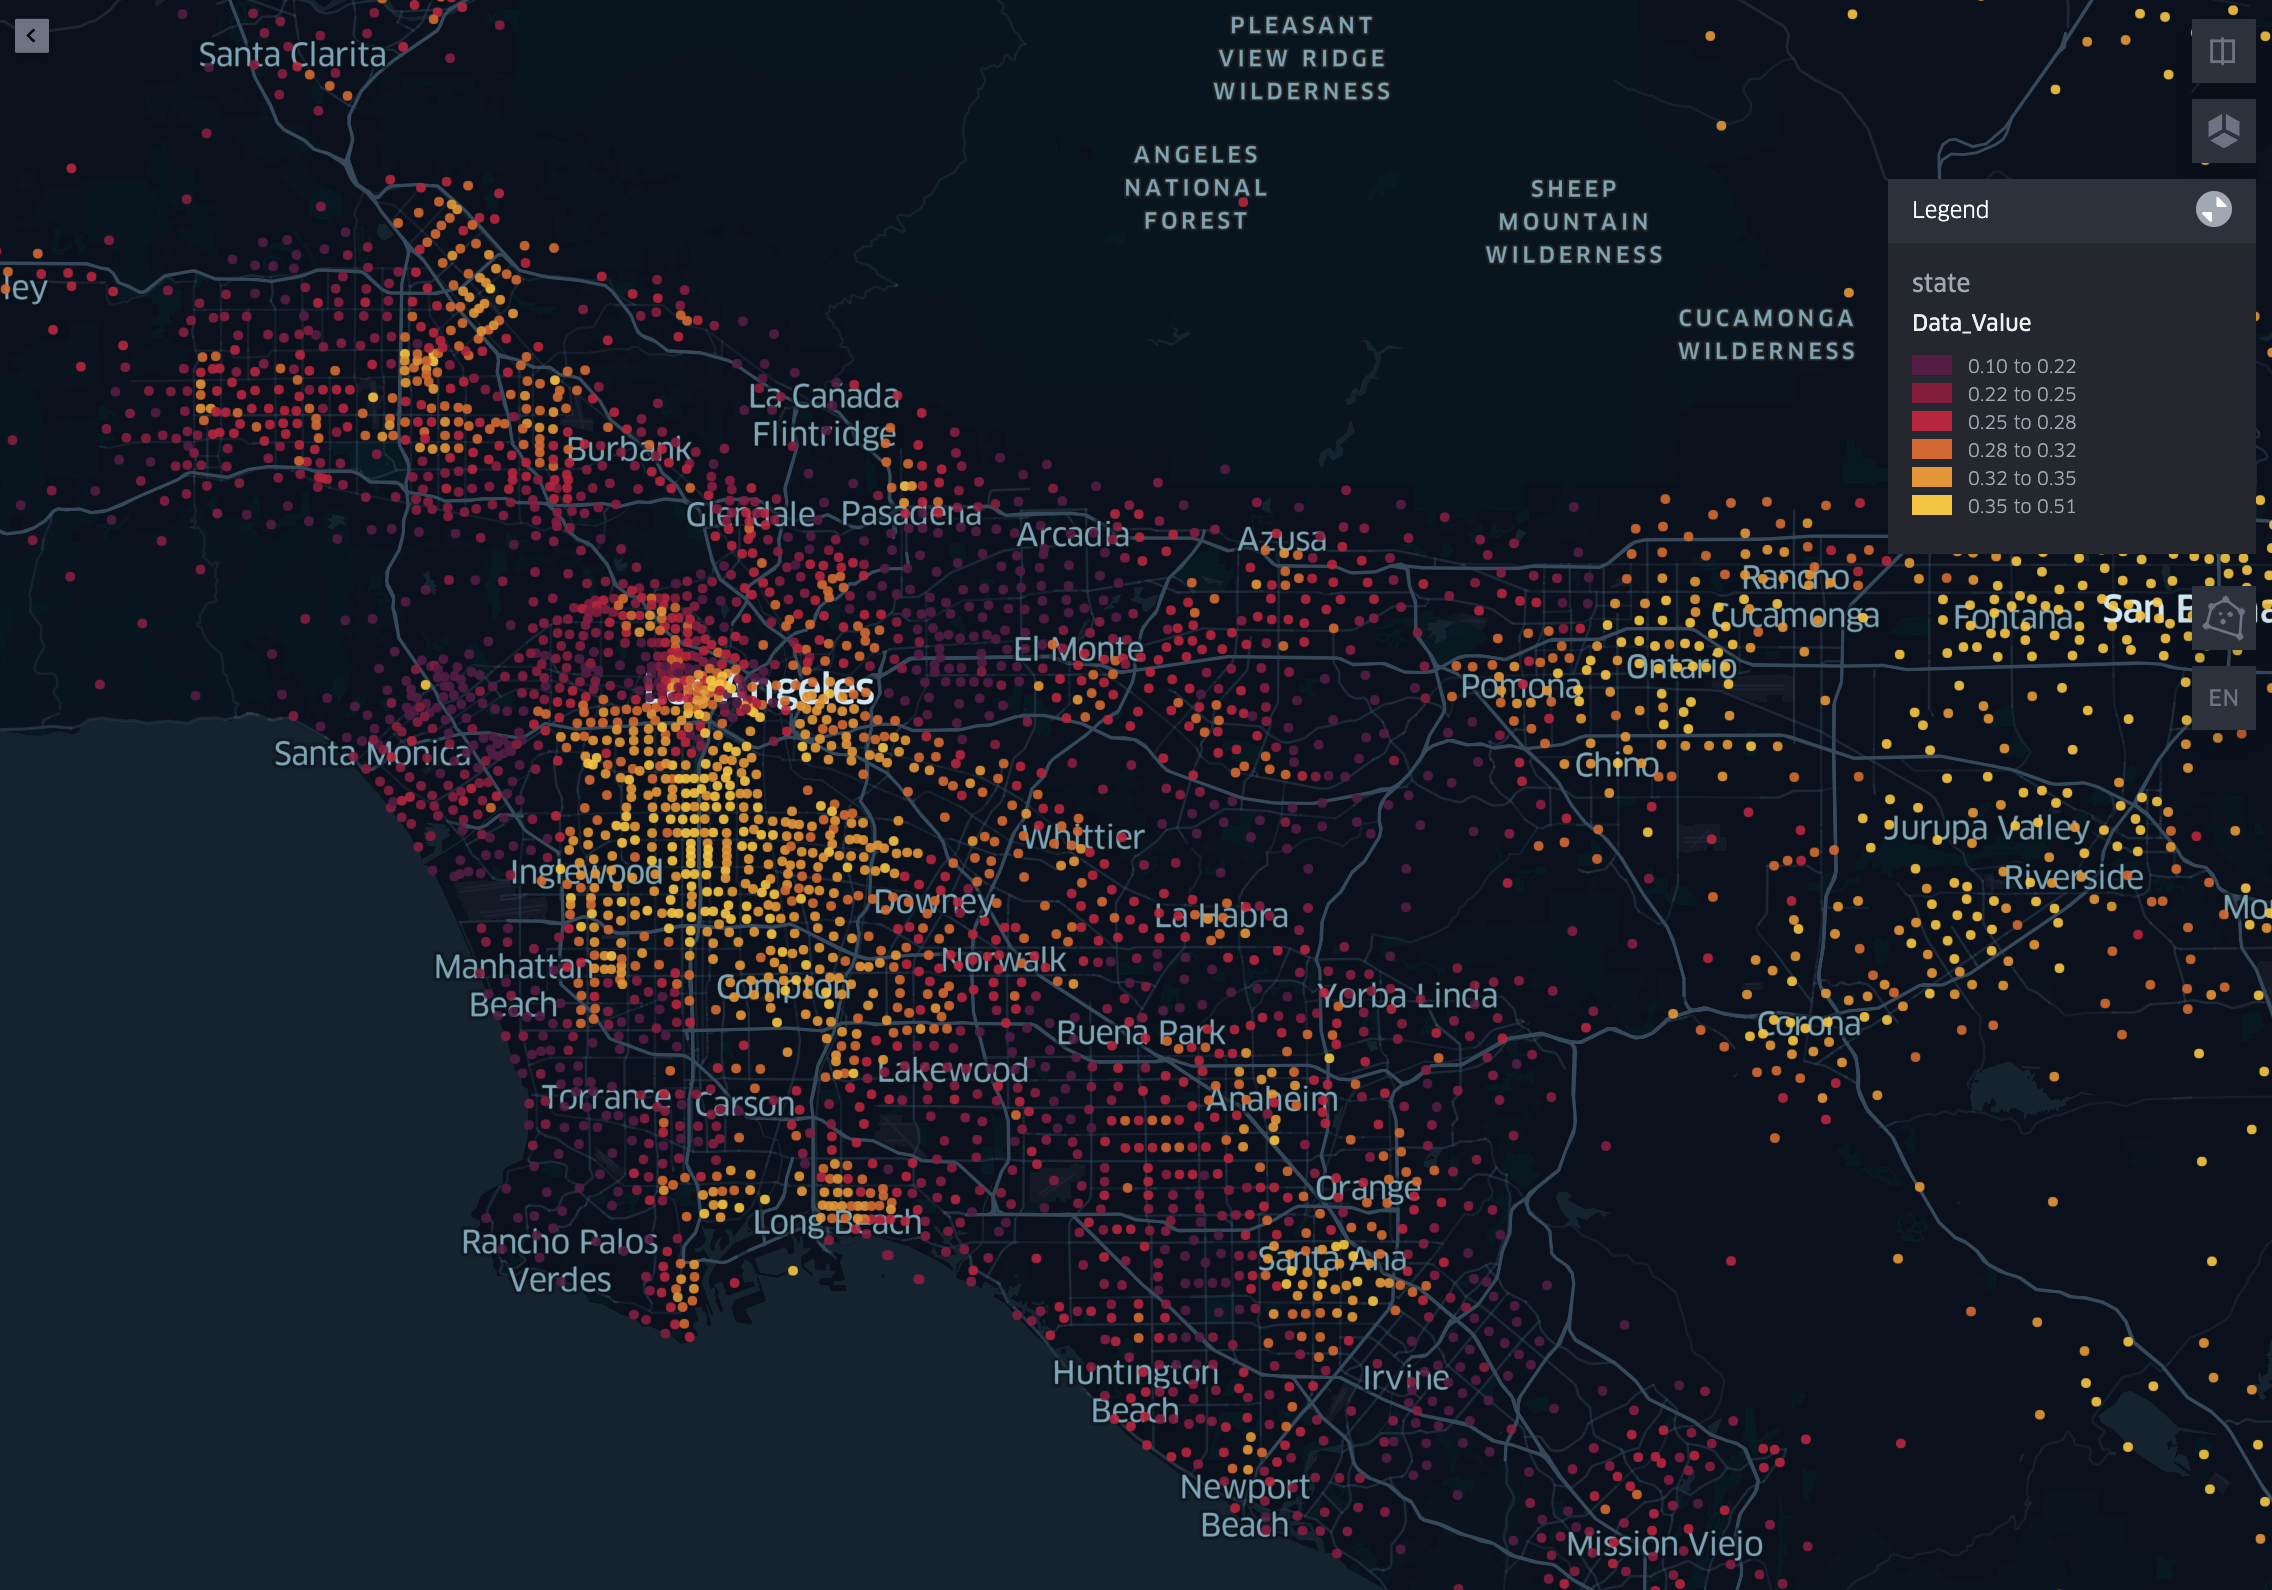
2SFCA Accessibility and Obesity Maps in Los Angeles
Spatial Clustering with Local Getis-Ord G
The Local Getis-Ord G (Gi*) statistic is used to identify spatial clusters of high and low values, commonly referred to as hotspots and cold spots. Unlike global spatial statistics, which summarize patterns across the entire study area, the Local Getis-Ord G evaluates each location individually by comparing its value and those of its neighbors to the overall dataset. The result is a standardized score indicating whether a location is part of a statistically significant cluster of high values (hotspot) or low values (cold spot).
In this project, Local Getis-Ord G is used to detect clustering patterns in both obesity rates and fast food accessibility across census groups. This allows for a localized understanding of spatial structure, helping identify whether areas of high accessibility coincide with areas of high obesity, or whether different spatial patterns emerge. By focusing on statistically significant clusters, this method provides clearer insight into geographic patterns than simple visual comparison alone.
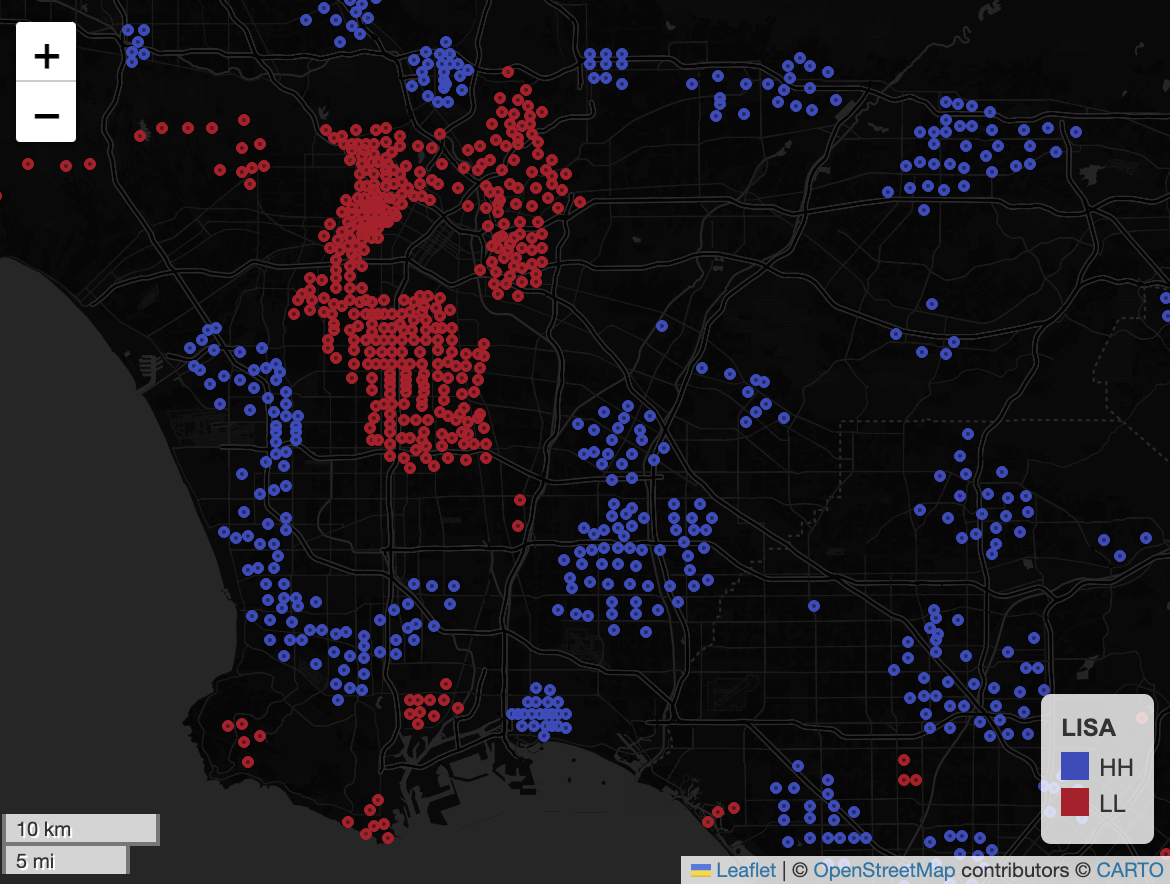
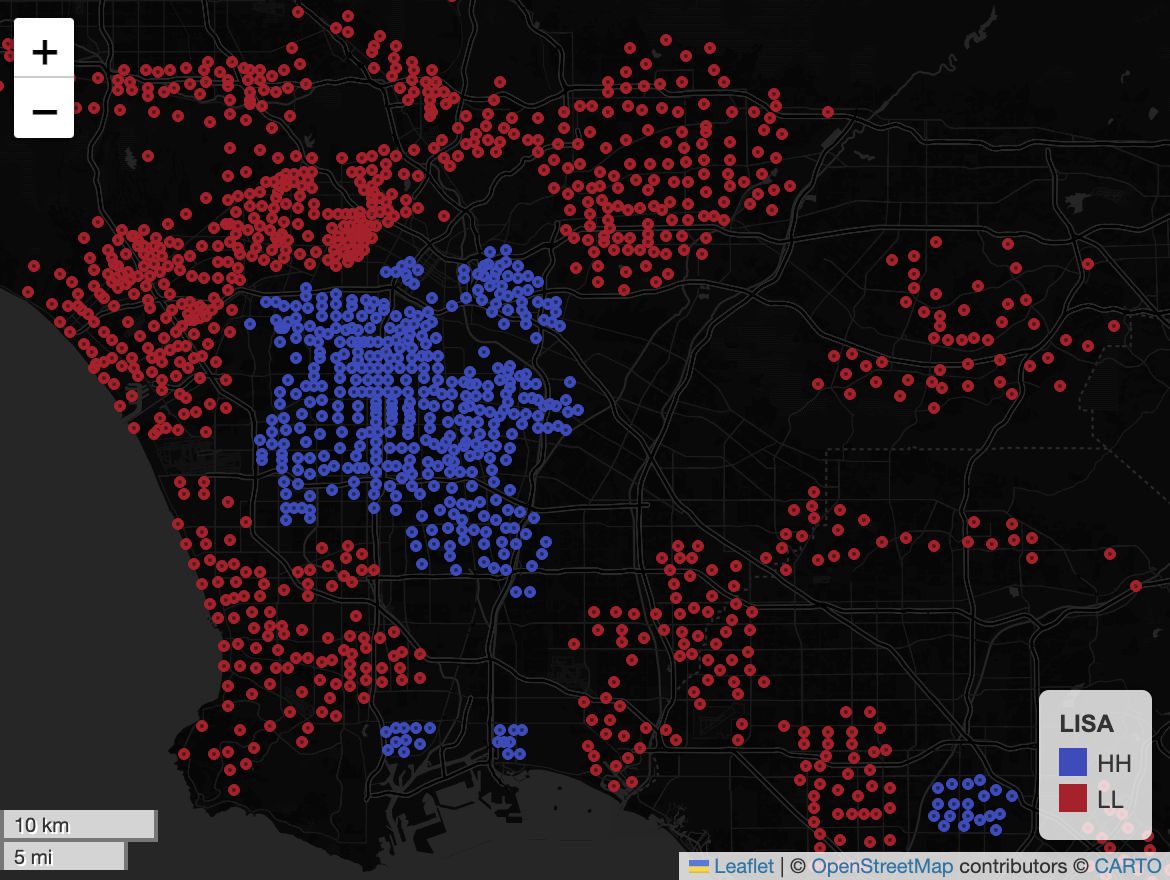
Visual Interpretation
A notable visual pattern is that some low-accessibility clusters appear near high-obesity clusters, while some high-accessibility clusters appear near lower-obesity areas. This creates the impression of an almost negative spatial relationship in certain parts of the map. At the same time, the broader landscape shows only weak and inconsistent patterning, suggesting that any relationship between fast food accessibility and obesity is far from uniform.
Urbanicity also appears to shape both variables. In downtown Los Angeles, obesity hotspots and fast food accessibility cold spots can coexist, while other areas display lower obesity clustering alongside different accessibility conditions. This suggests that urban form, density, and neighborhood context likely influence both access and health outcomes in ways that are not captured by proximity alone.
Why the Relationship May Look Visually Negative
Several mechanisms may explain why lower observed fast food accessibility can visually coincide with higher obesity in some places. People do not necessarily eat where they live. Commuting patterns, online food delivery, work-based consumption, and travel outside the home neighborhood all weaken the link between residential fast food access and actual consumption. In addition, dense urban neighborhoods may contain very different social and economic conditions despite close physical spacing, causing local obesity rates to reflect factors beyond nearby restaurant supply.
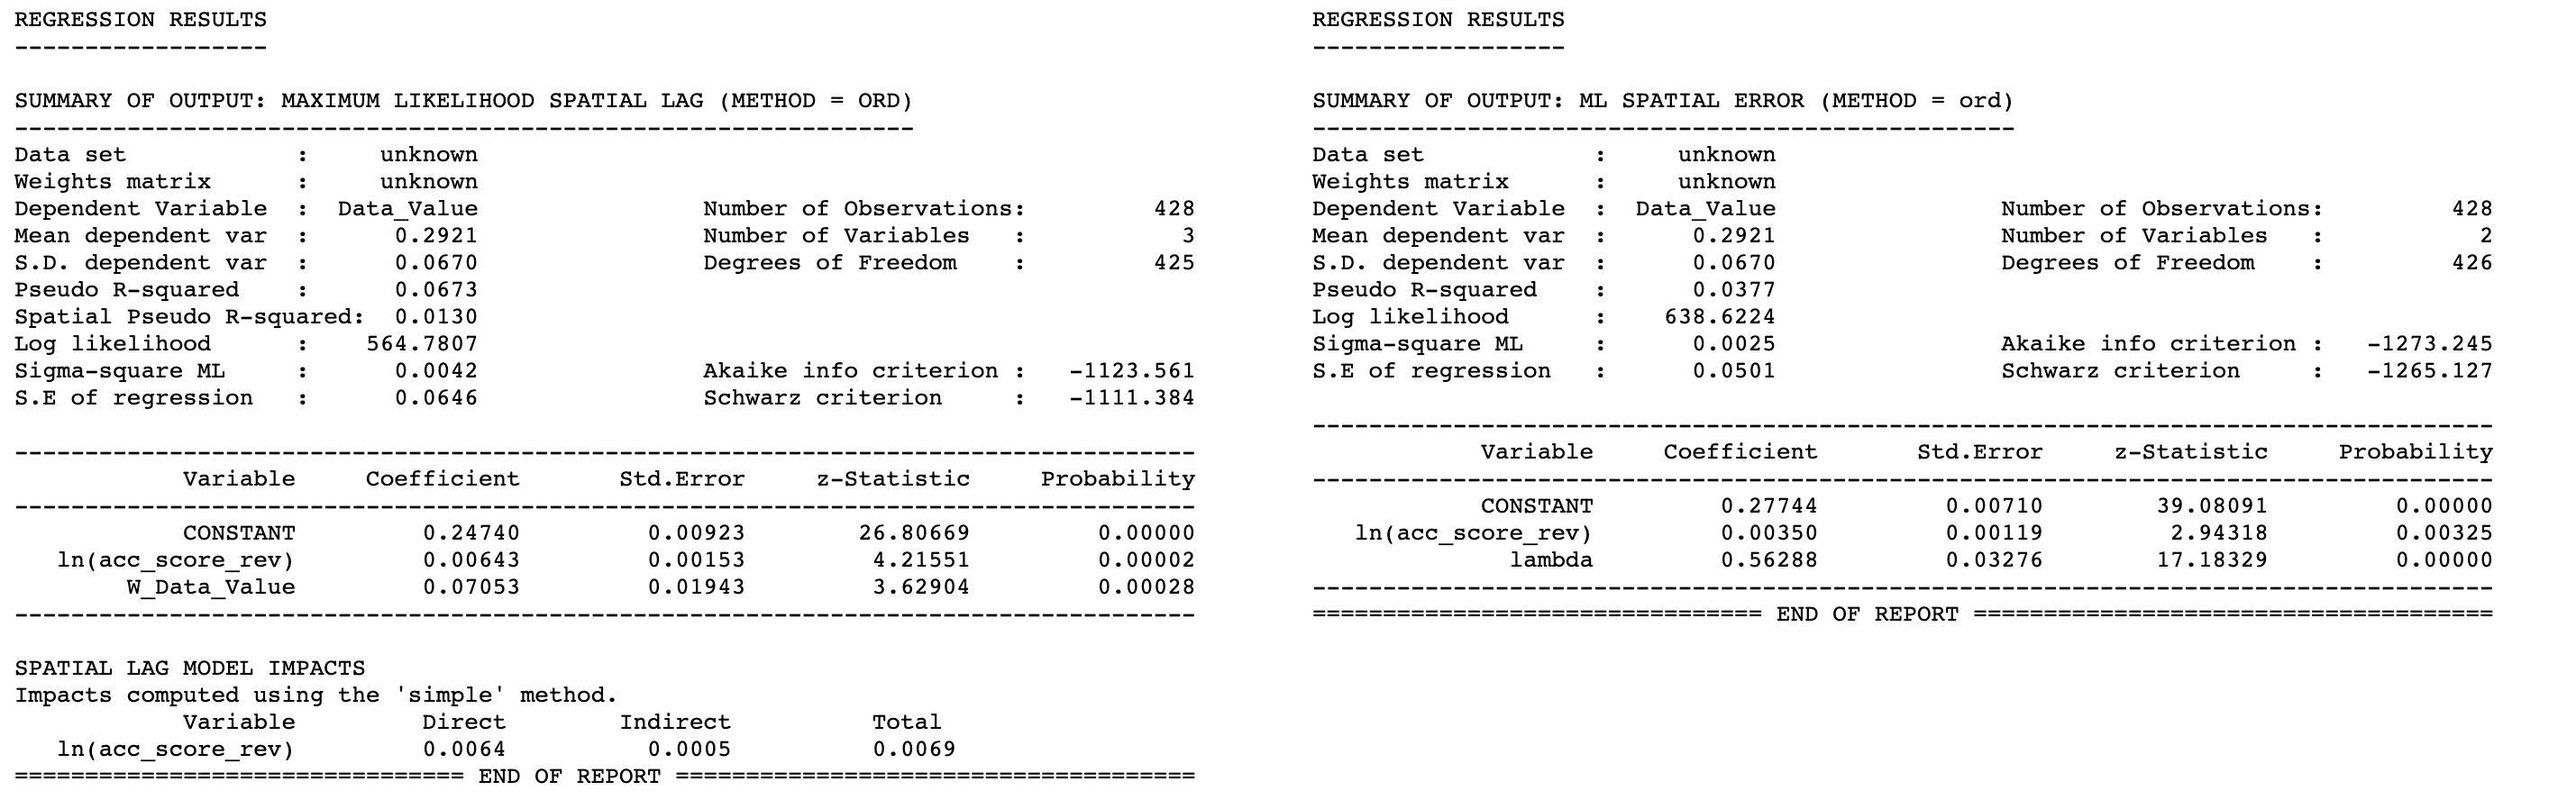
Maximum Likelihood Spatial Regression
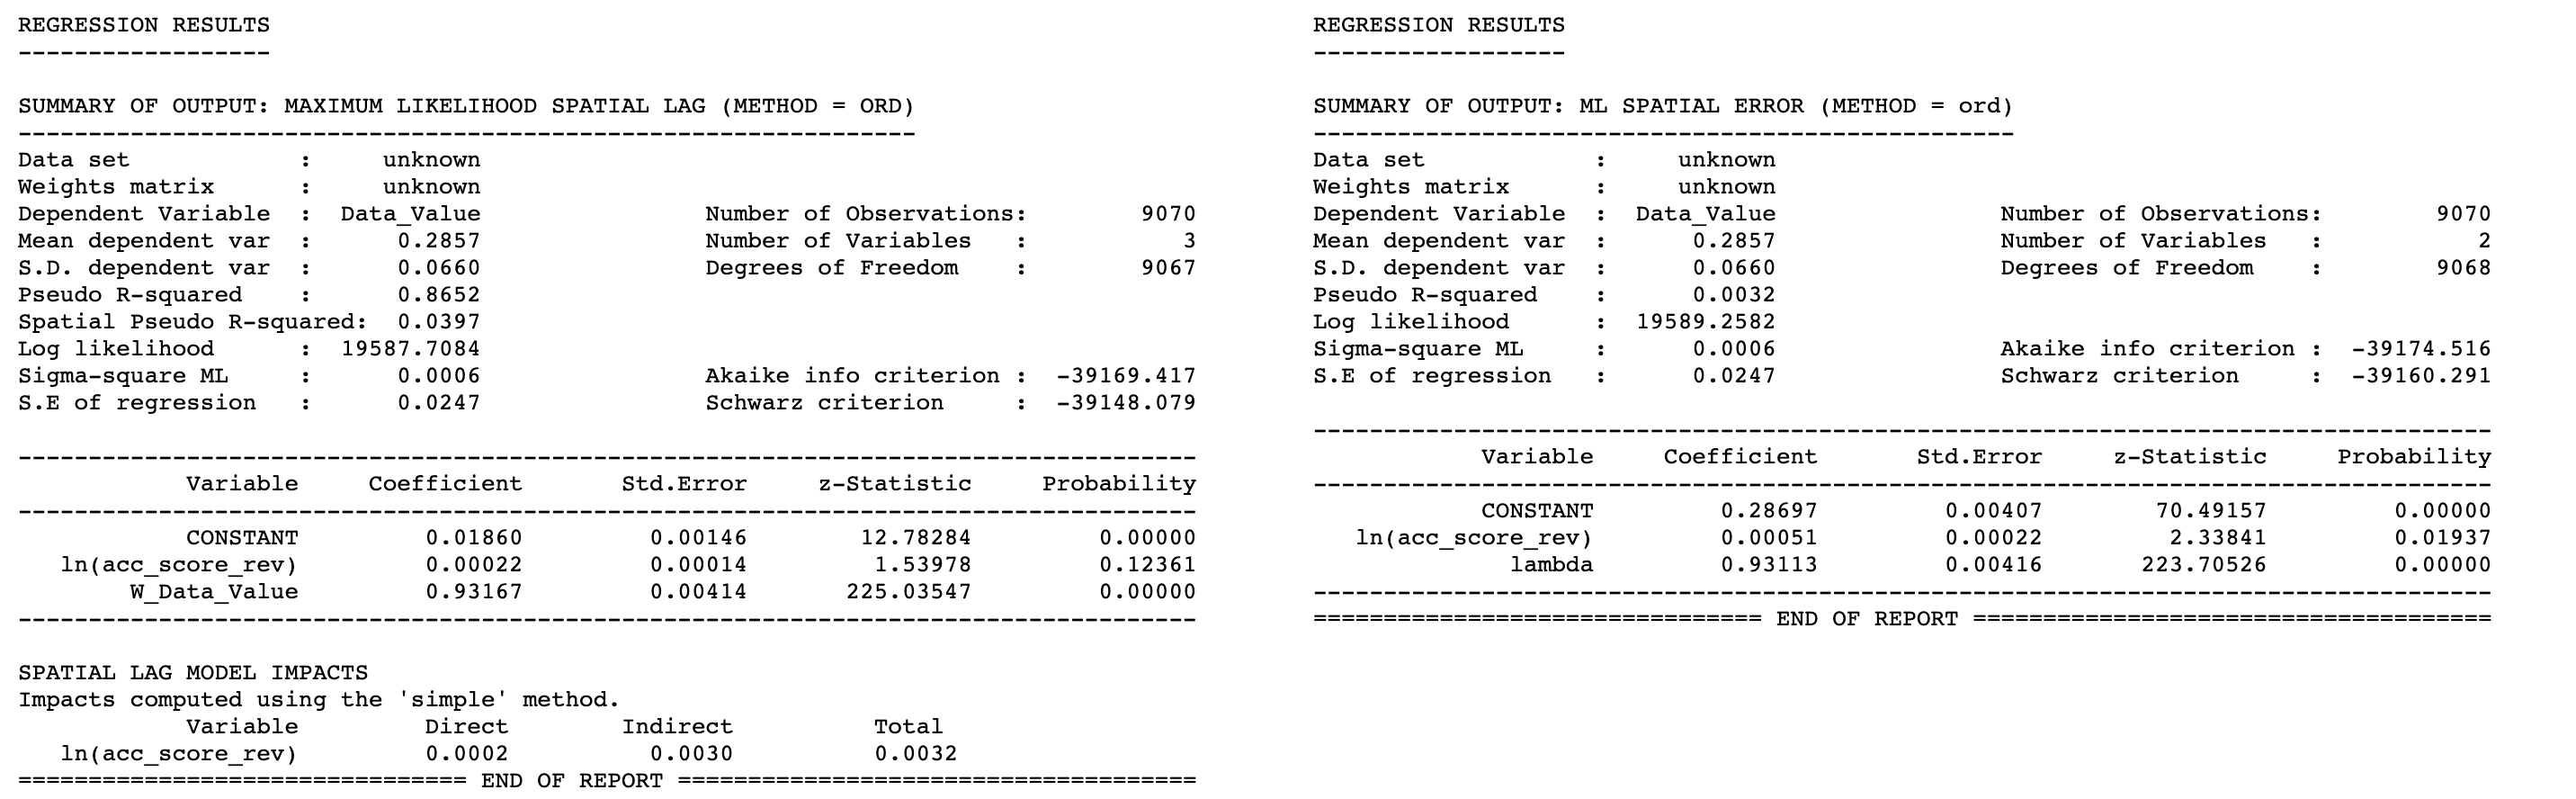
Spatial Regression Controlling for Urbanicity
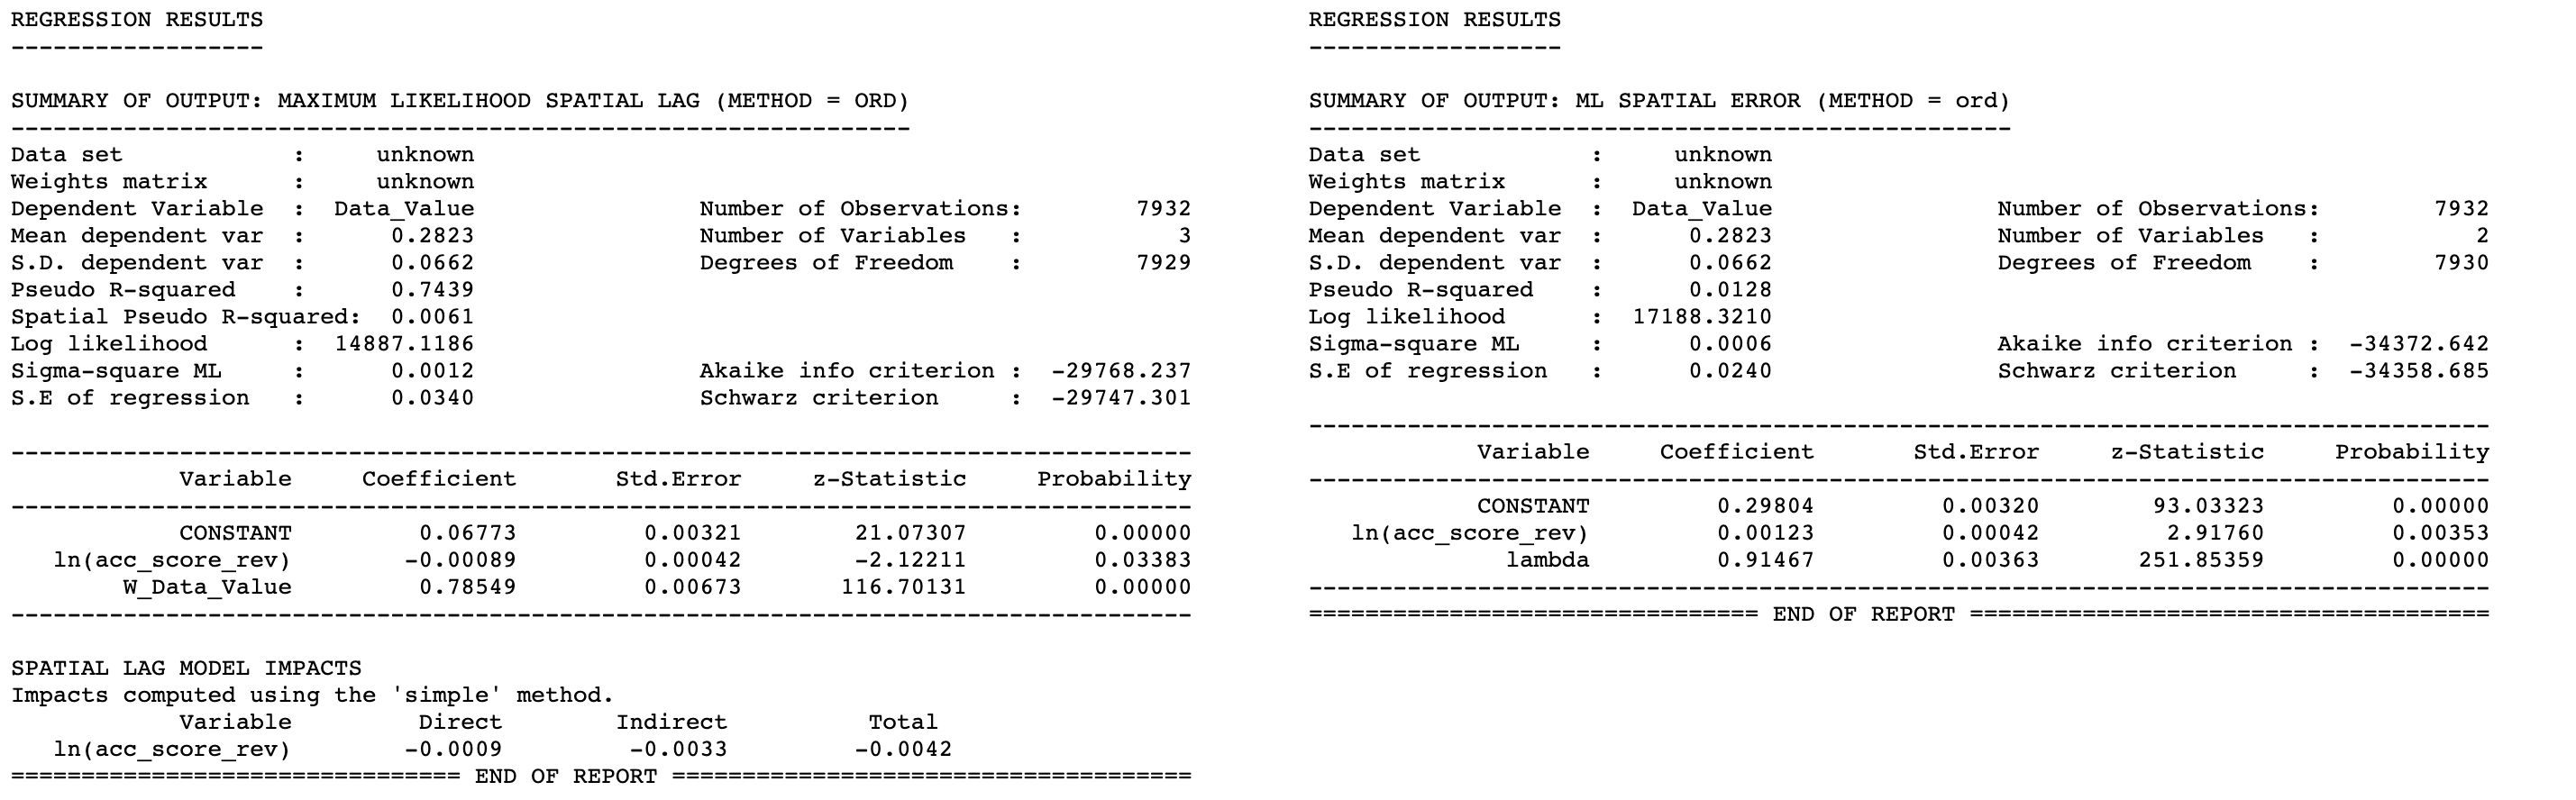
Limitations and Future Improvements
There are several structural reasons why this experiment may be predisposed to show weak or inconsistent spatial correlation between fast food accessibility and obesity. Obesity is a long-term health outcome influenced by many interlocking factors, including household income, education, physical activity, food preferences, commuting routines, access to grocery alternatives, and health care context. Fast food accessibility alone is therefore unlikely to explain much of the spatial variation by itself.
The study also relies on residential geography, yet food consumption behavior often occurs away from home. People may purchase fast food near workplaces, along commutes, through delivery platforms, or during non-routine travel. This means residential accessibility is only a partial proxy for actual exposure. In addition, sales volume captures commercial activity rather than direct dietary intake, and the different datasets may not be perfectly aligned in time.
Future improvements could strengthen the analysis by incorporating mobility and commuting data, using network-based travel time instead of Euclidean distance, including socioeconomic controls at finer resolution, separating urban from suburban and rural dynamics more explicitly, and modeling food consumption environments beyond fast food alone. A broader framework that includes grocery access, income, delivery penetration, and travel behavior would likely provide a more realistic understanding of how place influences obesity.